Introduction
Apache Spark, described as a “unified analytics engine for large-scale data processing,” has emerged as one of the most active open-source distributed computing frameworks. With almost 26k forks and 34k stars, it is the fourth most-popular repository on the Apache Software Foundation’s GitHub profile. It was originally developed at the University of California, Berkeley, as an improvement over Apache Hadoop and is reported to be approximately 100 times faster. While both make use of parallel computing, they differ in a variety of ways. One of the key differences is that Hadoop’s MapReduce processes data in batches and writes each intermediate results to disk, whereas Spark uses RAM to significantly reduce the amount of disk operations required. This allows Spark to run with very low latency and to handle continuous data streams from sources such as social media or IoT (Internet of Things) devices!
While Spark is natively written in Scala for scalability on the JVM (Java Virtual Machine), Spark code can be implemented in any of its high-level APIs, which include Scala, Java, Python, and R. In this blog post, we will use the Python API — PySpark. PySpark was once poorly supported in comparison to the Scala version, but it is now a first-class Spark API and is the natural choice for many data scientists and data engineers. However, it is worth mentioning that Scala is roughly 10 times faster than Python and should probably be the language of choice when deploying a large-scale Spark application in production.
A cluster manager is required to allocate resources across applications to take advantage of Spark’s distributed computing capabilities. Hadoop YARN (Yet Another Resource Negotiator) has traditionally been deployed in conjunction with Spark to do this. It also supports several other cluster managers: Standalone Mode, Apache Mesos (deprecated), and Kubernetes (K8s). K8s, which was originally developed by Google and is currently maintained by the CNCF (Cloud Native Computing Foundation), has seen a meteoric rise in the DevOps space in recent years. It is now the de-facto standard for production-level container orchestration, allowing for automated software deployment and scaling. This deployment mode has gained a lot of traction since its introduction in Spark 2.3. The following are just a few of the major benefits of running Spark on Kubernetes rather than YARN.
-
- K8s allows multiple applications to coexist on a single cluster. Furthermore, namespaces keep workloads from interfering with one another.
-
- K8s requires Spark applications and their dependencies to be packaged into containers. This resolves typical Spark conflict concerns.
-
- K8s delivers effective resource management with more control over the amount of compute or memory consumed by each application.
-
- K8s is an open-source project, which means it is a cloud-agnostic deployment that helps organisations avoid vendor lock-in.
-
- K8s is offered by every major cloud vendor and is the future of big data analytics applications.
Overview
The Python library Tweepy will be used in this project to stream tweets on a specific topic in real-time. After that, the spark-submit command will be executed to launch a Spark application on a Minikube cluster. The results of this application’s sentiment analysis of the Twitter stream will be appended to a PostgreSQL database table. Finally, the Python library Streamlit will then be used to visualise the findings in a real-time dashboard.
A few prerequisites must be installed before starting this tutorial. The README of the GitHub repository that contains this article’s source code includes a brief guide.
Tweepy Application
As previously mentioned, Spark excels at managing continuous data streams. This project will use the Python library Tweepy to retrieve data from the Twitter API. Before continuing, register an account on Twitter’s Developer Portal, create a free project, and place each of your authentication tokens into a file called .env. This file should be copied and pasted into each application folder.
BEARER_TOKEN=<YOUR_BEARER_TOKEN_HERE>
DB_NAME=postgresdb
DB_USER=ubuntu
DB_PASS=ubuntu
DB_HOST=<YOUR_MINIKUBE_IP_HERE>
DB_PORT=30432
The Twitter API requires that at least one rule be defined before a stream can be initialised. In other words, general tweets cannot be retrieved; they must have a specific hashtag or phrase. The GitHub repository contains a Jupyter Notebook where rules can be simply added or removed. For instance, the following rule can be created to fetch tweets that are in English and original (not a quotation, reply, or retweet).
After initialising a stream based on the newly defined rules, each received JSON string is loaded as a Python dictionary, and keys of interest are selected. It is then dumped back into a JSON string, encoded, and made available via a TCP socket that accepts incoming connections. This is the continuous data stream that will be consumed by the Spark application. A connection to a PostgreSQL database is established, and SQL queries are executed to build tables into which our Spark application will save results.
# Receiving tweet and selecting fields of interest
print(f"========== Tweet # {self.i} ==========")
full_tweet = json.loads(data)

keys = ['text', 'created_at']
tweet_dict = { k:full_tweet['data'][k] for k in keys }
tweet_string = json.dumps(tweet_dict)

# Sending tweet to the socket
tweet_encoded = (tweet_string + "\n").encode('utf-8')
print(tweet_encoded)
s_conn.send(tweet_encoded)
PySpark Application
Spark Structured Streaming, which is based on Spark’s SQL processing engine, is leveraged to manage continuous data streams in a scalable manner with end-to-end fault tolerance. By processing the data incrementally as it comes in, streaming data can be handled similarly to regular batch processes.
The aim of this PySpark application is to use the Python library VADER to perform some fundamental sentiment analysis on each incoming tweet. The application connects to the socket created in the previous step and loads each JSON string into a PySpark dataframe with the user-defined schema. However, each tweet’s text must first be pre-processed, which includes removing any retweet symbols, Twitter handles and hashtags, hyperlinks, and special characters.
Each tweet’s sentiment strength is then quantified with a polarity score on a scale of 1 to -1. A positive sentiment is indicated by a score greater than or equal to 0.05, while a negative sentiment is indicated by a value less than or equal to -0.05. The PySpark application is set up to carry out sentiment analysis in mini batches every 10 seconds, with the results appended to the previously created PostgreSQL database table using a JDBC driver.
# Creating the SparkSession
spark = SparkSession \
         .builder \
         .appName("SparkStreaming") \
         .getOrCreate()

# Defining the schema of the incoming JSON string
schema = StructType([
         StructField("text", StringType(), True),
         StructField("created_at" , TimestampType(), True)
         ])

# Consuming the data stream from the twitter_app.py socket
tweets_df = spark \
             .readStream \
             .format("socket") \
             .option("host", "twitter-service") \
             .option("port", 9999) \
             .load() \
            .select(F.from_json(F.col("value").cast("string"), schema).alias("tmp")).select("tmp.*")

# Starting to process the stream in mini batches every ten seconds
q1 = tweets_df \
         .writeStream \
         .outputMode("append") \
         .foreachBatch(batch_hashtags) \
         .option("checkpointLocation", "./check") \
         .trigger(processingTime='10 seconds') \
         .start()

q1.awaitTermination()
The VADER function requires a UDF (user-defined function), which should only be used if PySpark does not already include the necessary function. The disadvantage of doing this is that the application cannot benefit from the PySpark code that has been optimized. However, this is acceptable in this example since Minikube (a local single-node K8s cluster) is being used.
Streamlit Application
Real-time visualisation is the final step in this data pipeline. The database table is read by the Streamlit dashboard once every 10 seconds, which is the same length of time between each micro batch. The visualisations on this dashboard can be updated in real-time using placeholders; otherwise, current results are displayed underneath the old ones, which is not particularly user-friendly.
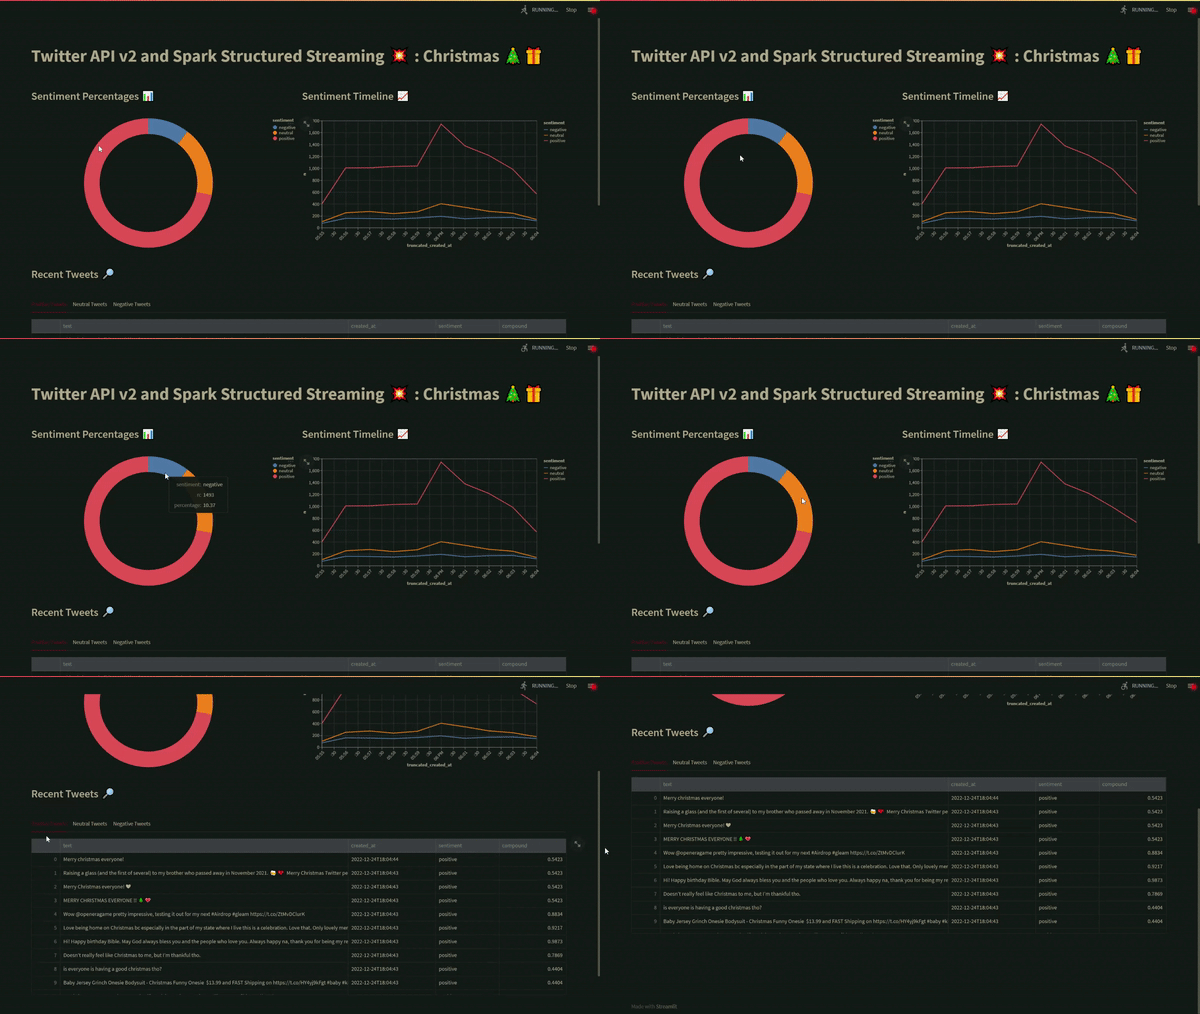
A donut chart showing the total number of positive negative, and neutral tweets is shown in the first visualisation. In the second visualisation, the total number of positive, negative, and neutral tweets each minute are displayed in a time-series chart. The dashboard’s bottom portion displays all the positive, negative, and neutral tweets in different tabs that may be individually sorted to show the most positive or negative tweets.
The code contains the SQL queries that were written to extrapolate these results. When seeking to assess the mood of sporting or political events, etc., in real-time, this application can be quite helpful!
# Getting the total percentage of each sentiment category
percent_query = '''
WITH t1 as (
SELECT sentiment, COUNT(*) AS n
FROM tweets
GROUP BY sentiment
)

SELECT sentiment, n, ROUND((n)/(SUM(n) OVER ()) * 100, 2)::real AS "percentage"
FROM t1;
'''

# Getting the total count of each sentiment category per minute
count_query = '''
WITH t1 as (
SELECT *, date_trunc('minute', created_at) AS truncated_created_at
FROM tweets
)

SELECT sentiment, COUNT(*) AS n, truncated_created_at
FROM t1
GROUP BY truncated_created_at, sentiment
ORDER BY truncated_created_at, sentiment;
'''

# Getting all of the tweets belonging to each sentiment category
negative_tweets = '''
SELECT text, created_at, sentiment, compound FROM tweets WHERE sentiment = 'negative' ORDER BY created_at DESC;
'''
neutral_tweets = '''
SELECT text, created_at, sentiment, compound FROM tweets WHERE sentiment = 'neutral' ORDER BY created_at DESC;
'''
positive_tweets = '''
SELECT text, created_at, sentiment, compound FROM tweets WHERE sentiment = 'positive' ORDER BY created_at DESC;
'''
Enable Role-Based Access Control (RBAC)
K8s uses service accounts and RBAC (Role-Based Access Control) roles to regulate access to the cluster’s resources. The Spark driver pod requires access to a service account that has the permission to create and monitor executor pods and services. A new service account is created within the desired namespace to accomplish this. By passing the clusterrolebinding flag to the kubectl command, the service account is assigned an edit clusterrole.
Create a new namespace.
kubectl create ns pyspark
Set it as the default namespace.
kubectl config set-context --curent --namespace=pyspark
Create a new service account.
kubectl create serviceaccount pyspark-service -n pyspark
Grant the service account access to resources in the namespace.
kubectl create clusterrolebinding pyspark-clusterrole \
    --clusterrole=edit \
    --serviceaccount=pyspark:pyspark-service \
    -n pyspark
Build Docker Images
The Docker images for each of the applications must now be created. Images provide a blueprint for creating K8s pods (a group of one or more containerised workloads).
Point the terminal to the Minikube Docker daemon.
eval $(minikube -p minikube docker-env)
Build PySpark Image
Create the PySpark image by changing the directory to Spark’s home directory and executing the following shell script.
cd $SPARK_HOME
./bin/docker-image-tool.sh \
    -m \
    -t v3.3.1 \
    -p ./kubernetes/dockerfiles/spark/bindings/python/Dockerfile \
    build
Build Application Images
The subsequent step involves using the previous image as a base to create a new image for the actual PySpark application. Once finished, create the Tweepy and Streamlit images in each of their directories—every folder comes with the necessary Dockerfile inside. Once everything has been built and is available in the Docker registry inside of Minikube, run the docker images command to verify it.
Inside ‘2. twitter-app’.
docker build -t twitter-app:1.0 .
Inside ‘3. spark-app’.
docker build -t spark-app:1.0 .
Inside ‘4. streamlit-app’.
docker build -t streamlit-app:1.0 .
List the Docker images.
docker images
Deploy to Minikube
Now that the Docker images are prepared, they may be deployed to the Minikube cluster. Run the minikube dashboard command to access the web-based Kubernetes interface. Interact with this for troubleshooting, such as connecting with the containerised application’s shell or reviewing its logs, etc.
Start Minikube dashboard.
minikube dashboard
PostgreSQL and pgAdmin Deployment
The PostgreSQL database and pgAdmin will be deployed first. Additionally, two NodePort services will be included to allow access to the database and interface from outside the cluster. To access this pgAdmin service at a given port, run the minikube service command.
Inside ‘1. postgresql’, start PgAdmin and PostgreSQL.
kubectl apply -f .
Access pgAdmin from outside the cluster.
minikube service pgadmin-service -n pyspark
Tweepy Deployment
The Tweepy application will be deployed as the second component. Since this application consists of just a single pod, it is not a deployment in the same sense as PostgreSQL, pgAdmin, or Streamlit. However, this pod’s sole function is to provide a TCP socket where all incoming tweets can be accessed.
This will not begin streaming the tweets until an incoming connection has been made. But keep in mind to terminate this pod once the PySpark application has been terminated; otherwise, it will keep streaming tweets and may exceed the rate limit.
Inside ‘2. twitter-app’, start Twitter stream socket.
kubectl apply -f twitter-app.yaml
PySpark Deployment
The PySpark application itself will be deployed to the Minikube cluster as the third component. The command spark-submit will be used in place of the kubectl command, which was employed in the prior deployments.
This command contains a lot of flags, so the complete command has been condensed into a single shell script. The location of the K8s server must be known when submitting the PySpark application; therefore, this information is stored in an environment variable. The location of the JDBC driver within the image also needs to be given to write the results to the database.
The remaining flags are configuration options. They consist of the specified PySpark image, the namespace, the number of executor pods, the service account, etc. The location of the actual PySpark application to execute within the image is then specified.
./bin/spark-submit \
    --master k8s://${K8S_SERVER} \
    --deploy-mode cluster \
    --jars local://${SPARK_HOME}/spark-app/postgresql-42.5.1.jar \
    --name spark-app \
    --conf spark.kubernetes.container.image=spark-app:1.0 \
    --conf spark.kubernetes.context=minikube \
    --conf spark.kubernetes.namespace=pyspark \
    --conf spark.kubernetes.driver.pod.name=pyspark-driver \
    --conf spark.kubernetes.driver.label.app=spark-app \
    --conf spark.executor.instances=1 \
    --conf spark.kubernetes.authenticate.driver.serviceAccountName=pyspark-service \
    --conf spark.kubernetes.file.upload.path=/tmp \
    --conf spark.kubernetes.submission.waitAppCompletion=false \
    local://${SPARK_HOME}/spark-app/spark_sentiment.py
A NodePort service to view the web user interface from outside the cluster is also included in a separate deployment file. To access this Spark service at a given port, run the minikube service command.
Inside ‘3. spark-app’, start the Spark service.
kubectl apply -f spark-service.yaml
To start the PySpark application, run the following command.
./start-spark-app.sh
To stop the PySpark application, run the following command.
./stop-spark-app.sh
Access the Spark web user interface from outside the cluster.
minikube service spark-service -n pyspark
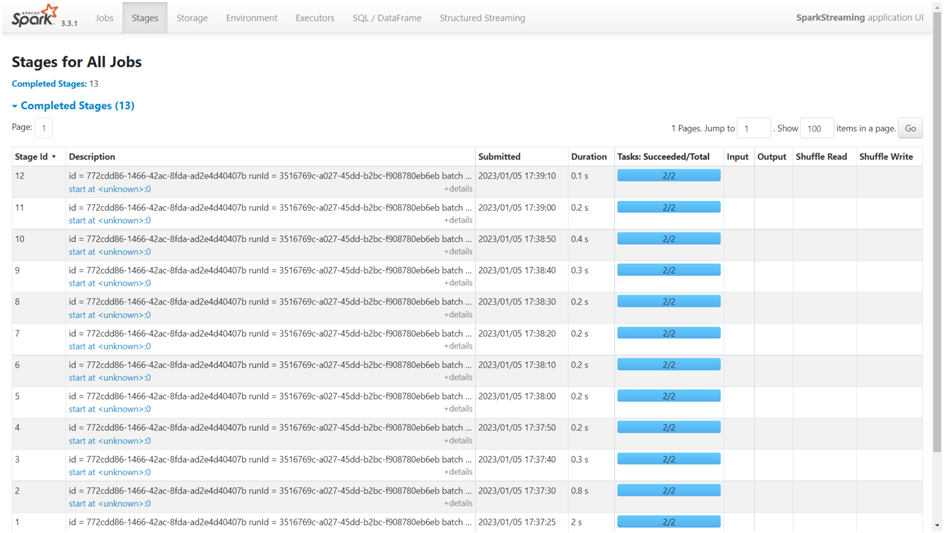
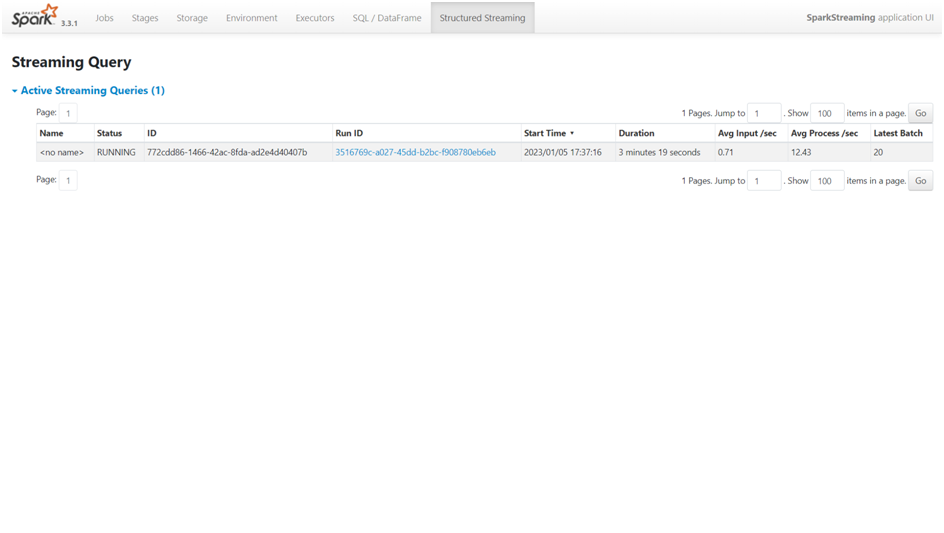
There are several tabs available in the Spark web user interface to track the setup, resource usage, and status of the Spark application. These tabs include ‘Jobs’, ‘Stages’, ‘Storage’, ‘Environment’, ‘Executors’, ‘SQL / Dataframe’, and ‘Structured Streaming’. For instance, the processing for each mini batch and the time it took to finish may be seen under the Stages tab (Figure 1). The Structured Streaming tab shows the job’s running time, average processing times, etc. (Figure 2).
Streamlit Deployment
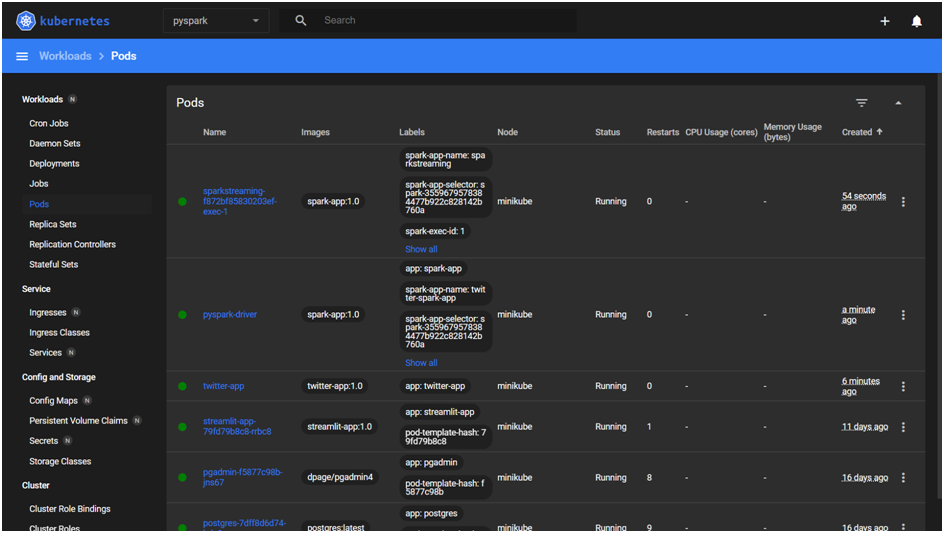
The Streamlit application is the last thing to be deployed. A NodePort service to view the dashboard from outside the cluster is also included in this deployment file. To access this Streamlit service at a given port, run the minikube service command (Figure 3).
Inside ‘4. streamlit-app’, start the Streamlit dashboard.
kubectl apply -f streamlit-app.yaml
Access the Streamlit dashboard from outside the cluster.
minikube service streamlit-service -n pyspark
Summary
You should be able to observe the Streamlit dashboard update the results in real-time if everything has been deployed correctly and the containers are operating without errors (Figure 4). The usage of K8s as a resource manager by Spark has now been demonstrated. While sentiment analysis on a continuous data stream demonstrated in this blog post was done using Structured Streaming, Spark is capable of much more, including Machine Learning at very large scales. Minikube (a local single-node K8s cluster) and a single Spark executor were used in this project, but the same concepts may be applied to production-grade clusters provided by leading cloud providers like AWS, Azure, DigitalOcean, GCP, among others.
Use Cases in Agriculture
At Cropway, we are developing innovative technological solutions for the agricultural sector. For example, Spark Structured Streaming can be leveraged to support real-time applications like crop health monitoring, weather pattern forecasting, livestock health and wellbeing monitoring, and supply chain management.
-
- Crop health monitoring: IoT devices can continuously produce data on temperature, nutrient levels, and soil moisture. This information can then be used to improve irrigation and fertilisation techniques and identify potential problems in real-time using a streaming data pipeline.
-
- Weather pattern forecasting: Real-time data from IoT weather stations and satellite images may be analysed using a streaming data pipeline. This makes it possible to predict future weather patterns, aid farmers in improving crop management techniques, and help them get ready for severe weather.
-
- Livestock health and wellbeing monitoring: Animal activity, temperature, and feed intake may all be tracked using data from IoT devices. For instance, by keeping an eye on the health of animals, infections can be avoided, and diseases can be detected early, leading to better treatment procedures.
-
- Supply chain management: A streaming data pipeline can be used to track and analyse data continuously from different locations in the agricultural supply chain, such as farm production, shipping, and storage, to enhance procedures and identify bottlenecks.
I hope this article has helped you better understand how to run Spark on Kubernetes. Please share any comments or feedback you may have!
Credits
Matthew is Cropway’s Chief Data Scientist, with 3+ years of experience in a variety of fields and domains and a strong interest in emerging artificial intelligence technologies. He graduated with a first-class honours in MSc Big Data Analytics from Atlantic Technological University, Ireland. Exascale AI, which he cofounded, was named runner-up in the Ambition pre-accelerator programme by LEO Donegal, in partnership with NDRC. At Cropway, he designed and developed a production-ready blockchain-based supply chain application using Kubernetes and Hyperledger Fabric.

